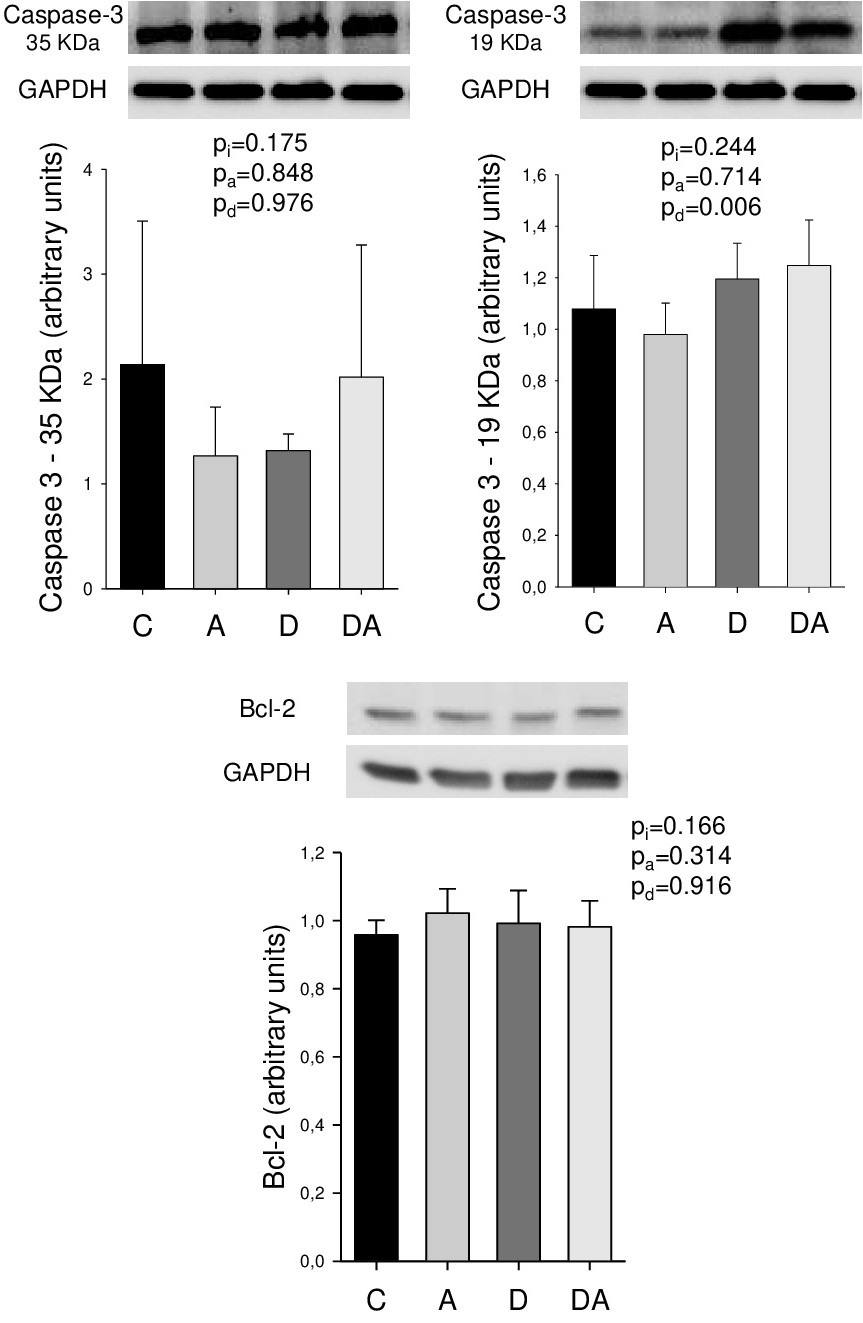
Fig. 2. Apoptosis-related protein expression. Figure shows Bcl-2 and caspase 3 protein expression evaluated by Western blot. All values of protein expression were normalized by GAPDH. C: control group; A: açai group; D: doxorubicin group; DA: doxorubicin + açai group. p value: two-way ANOVA; pi: p value for doxorubicin vs açai interaction; pa: p value for açai; pd: p value for doxorubicin.